Microbiome

Metagenomics & microbiome

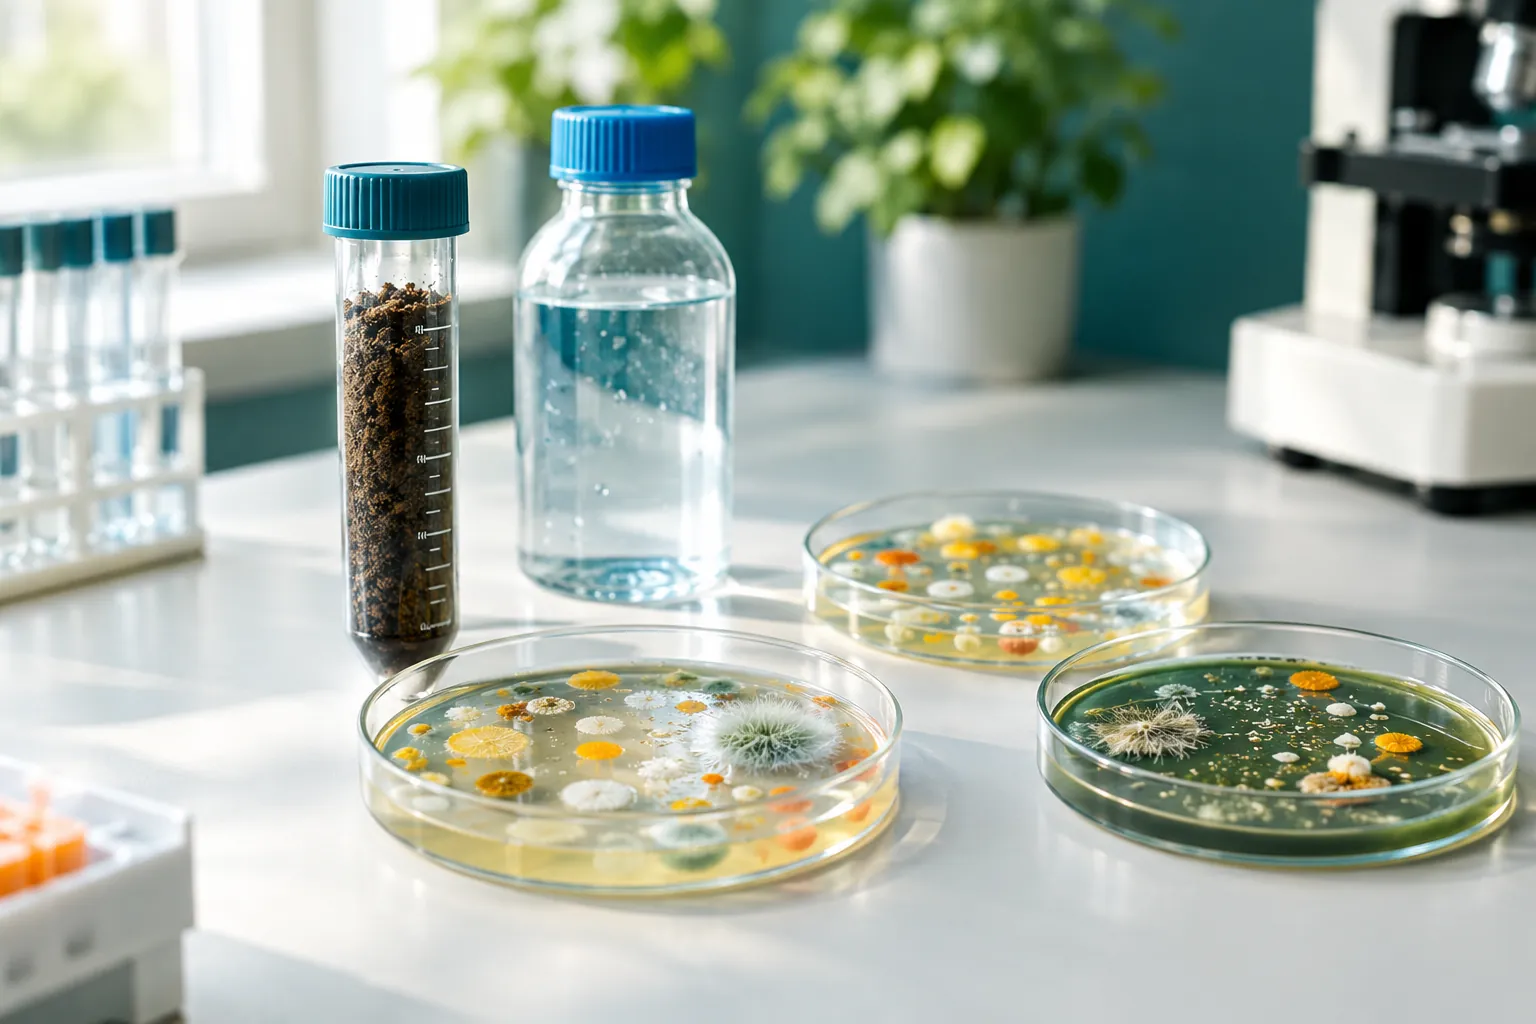
Find out which microbes live in a sample — soil, water, gut, food, mangrove or waste — without culturing them. Amplicon sequencing gives a cost-effective community profile; shotgun metagenomics also reveals genes and functions.

Metagenomics & microbiome
Turnaround
5–7 weeks after QC
Price
From BDT 12,000 per sample
Platforms
Illumina NovaSeq 6000

What we offer

  • Metagenomics sequencing (16S rRNA)
  • 18S sequencing
  • ITS sequencing
  • Shotgun metagenomics
  • Metabarcoding (12S, 16S and 18S)
  • Metatranscriptomics

Who it is for

Environmental, agricultural, aquaculture, food and gut-microbiome researchers.

What you receive

  • Raw data (FASTQ)
  • Taxonomic profile and diversity analysis
  • Functional and resistance-gene profiles (shotgun)

Services & prices

Choose your service, download its sample sheet, fill it in and attach it to the quote form. Prices are per sample unless stated and exclude VAT and tax. The final price is confirmed in your quotation, with no hidden costs and no advance payment.

16S rRNA amplicon sequencing (V3–V4)

BDT 12,000 per sample

Special offer (regular price BDT 14,000). Bulk price for more than 20 samples.

Turnaround: 5–6 weeks after sample QC

  • Raw samples or extracted DNA (eDNA): 20 ng/µL × 20 µL
  • Illumina NovaSeq 6000, PE250, more than 1 million reads per sample

Metabarcoding (18S, ITS, 12S, COI, rbcL)

BDT 12,000 per gene per sample

Price includes eDNA extraction, QC, PCR, library preparation, sequencing and full analysis. Example: 10 samples × 3 genes = BDT 360,000. Bulk prices for more than 30 samples.

Turnaround: 5–6 weeks after sample QC

  • Raw samples or extracted DNA (eDNA)
  • Illumina NovaSeq 6000, PE250, more than 1 million reads per sample

Analysis: Free standard analysis: quality control, taxonomy and community composition.

▶ Related videos on YouTube

Shotgun metagenomics

BDT 40,000 per sample

BDT 35,000 per sample for 15 or more samples, standard analysis included. Bulk price for more than 100 samples.

Turnaround: 6–7 weeks after sample QC

  • Raw samples or extracted DNA: 20 ng/µL × 50 µL
  • Illumina NovaSeq 6000, PE150, more than 40 million reads (6–8 Gb) per sample
  • Host DNA removed where a reference genome is available

Analysis: Profiles of bacteria, fungi, DNA viruses and antimicrobial resistance genes.

▶ Related videos on YouTube

Not sure which option fits? Message us on WhatsApp. Packing and shipping steps are on How to order.

Methods & analysis workflow

16S rRNA amplicon sequencing (V3–V4)

How we process your samples and analyse the data, from DNA extraction to the final report. Download the full text to adapt for the methods section of your thesis or paper.

  1. Sample & DNAExtraction and quality check
  2. PCRV3–V4 amplification with barcoded primers
  3. LibraryPooling and Illumina library preparation
  4. SequencingNovaSeq 6000, paired-end 250 bp
  5. BioinformaticsClean reads, ASVs and taxonomy
  6. ReportDiversity, statistics and figures
Sample processing and DNA extraction

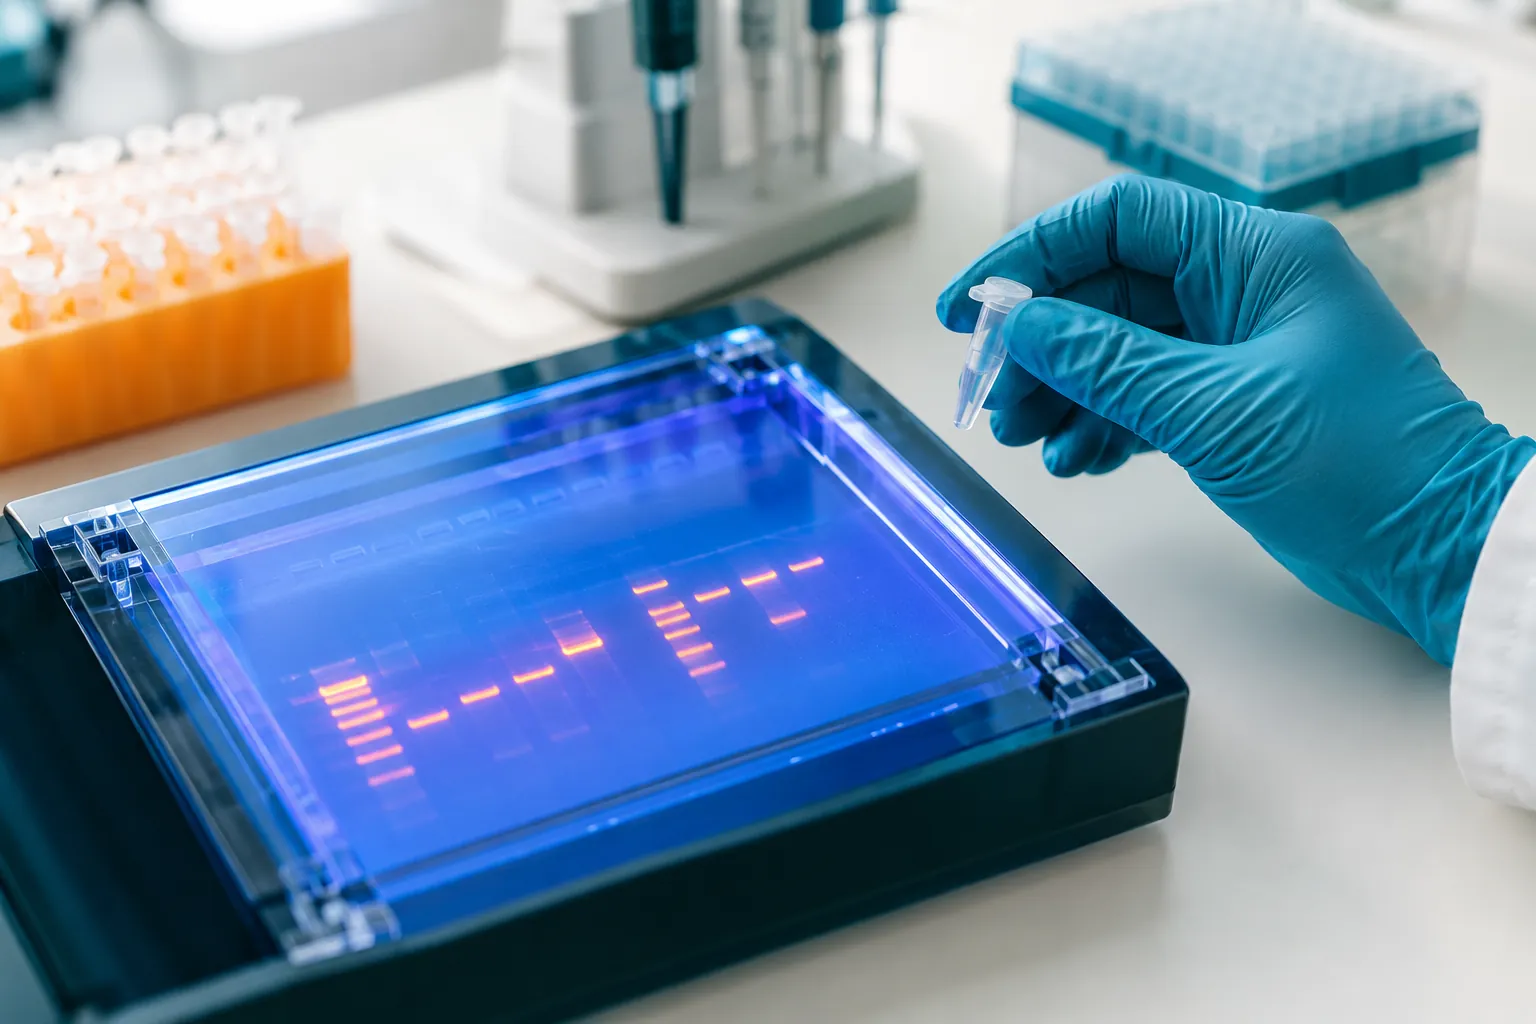
Environmental DNA (eDNA) is extracted with a CTAB / phenol–chloroform–isoamyl alcohol (PCI) protocol with minor modifications. Water samples (100 mL) are first filtered through a 0.22 µm membrane (Whatman); sediment and soil (about 0.25–0.5 g) are processed directly. Cells are lysed in pre-warmed CTAB buffer (100 mM Tris-HCl pH 8.0, 20 mM EDTA, 1.5 M NaCl, 2% CTAB) with β-mercaptoethanol and 0.5 mm glass beads (10 min vortexing), then digested with proteinase K at 55–65 °C and treated with RNase A at 37 °C. DNA is purified with phenol:chloroform:isoamyl alcohol (25:24:1) and chloroform:isoamyl alcohol (24:1), precipitated with cold isopropanol, washed with ethanol and dissolved in TE buffer. Purity is measured with a NanoDrop spectrophotometer (A260/A280 about 1.8–2.0) and integrity on a 1% agarose gel.

PCR amplification and sequencing

The hypervariable V3–V4 region of the bacterial 16S rRNA gene is amplified with barcoded primers 341F (5′-CCTAYGGGRBGCASCAG-3′) and 806R (5′-GGACTACHVGGGTWTCTAAT-3′) in 30 µL reactions with Promega G2 Green Master Mix: 98 °C for 1 min; 30 cycles of 98 °C for 10 s, 50 °C for 30 s and 72 °C for 30 s; and a final extension at 72 °C for 5 min. Products are checked on a 2% agarose gel, purified with the GeneJET Gel Extraction Kit and quantified with a Qubit fluorometer. Equimolar amplicons are pooled into libraries following the Illumina TruSeq protocol and sequenced on an Illumina NovaSeq 6000 (paired-end, 2 × 250 bp).

Read processing and taxonomic classification

Reads are demultiplexed by their 12 bp sample barcodes (custom Python script). Adapters and short reads are removed with Cutadapt, and paired reads are merged with FLASH. Fastp removes low-quality reads (Phred below Q19), and VSEARCH removes chimeric sequences (Rognes et al. 2016). Clean reads are denoised with DADA2 in QIIME2 to obtain amplicon sequence variants (ASVs) (Bolyen et al. 2019). A phylogenetic tree is built in QIIME2, and ASVs are classified with a naïve Bayesian classifier (Wang et al. 2007) trained on the SILVA 138 database (Quast et al. 2013).

Diversity and statistical analysis

Alpha diversity (Chao1 richness, Shannon and Simpson diversity, Pielou’s evenness, dominance and Good’s coverage) is calculated in QIIME2 and plotted in R (ggplot2, vegan, reshape2). Beta diversity is based on weighted and unweighted UniFrac distances, shown with Principal Coordinates Analysis (PCoA), Principal Component Analysis (PCA) and non-metric multidimensional scaling (NMDS). Differences between groups are tested with PERMANOVA (Adonis), ANOSIM and MRPP (Anderson 2001).

Biomarkers, functional prediction and environmental links

Differentially abundant taxa are identified with metagenomeSeq, and potential biomarkers with LEfSe (LDA score above 4). Community functions are predicted with PICRUSt2 (Douglas et al. 2020), phenotypes with BugBase, and ecological guilds with FAPROTAX and FUNGuild. Relationships between communities and environmental variables are explored with canonical correspondence analysis (CCA) and distance-based redundancy analysis (db-RDA) in R (vegan, psych).

Software and versions
StepSoftwareVersionKey settings
DemultiplexingPython (custom script)3.6.1312 bp barcodes
Adapter and short-read removalCutadapt3.3minimum length 20
Read mergingFLASH1.2.11min overlap 10, max mismatch density 0.2
Quality filteringfastp0.23.1-q 19 -u 15
Chimera removalVSEARCH2.16.0—
Denoising (ASVs), tree, taxonomyQIIME2 (DADA2)2022.2SILVA 138 classifier
Diversity, ordination, statisticsR4.0.3vegan, ade4, ggplot2
Biomarker discoveryLEfSe1.1.01LDA > 4
Differential abundancemetagenomeSeq (R)R 4.0.3—
Functional predictionPICRUSt22.4.1—
Phenotypes and guildsBugBase, FAPROTAX, FUNGuild——
References
  1. Anderson MJ (2001). A new method for non-parametric multivariate analysis of variance. Austral Ecology 26(1): 32–46. https://doi.org/10.1111/j.1442-9993.2001.01070.pp.x
  2. Bolyen E, Rideout JR, Dillon MR, et al. (2019). Reproducible, interactive, scalable and extensible microbiome data science using QIIME 2. Nature Biotechnology 37: 852–857. https://doi.org/10.1038/s41587-019-0209-9
  3. Douglas GM, Maffei VJ, Zaneveld JR, et al. (2020). PICRUSt2 for prediction of metagenome functions. Nature Biotechnology 38: 685–688. https://doi.org/10.1038/s41587-020-0548-6
  4. Quast C, Pruesse E, Yilmaz P, et al. (2013). The SILVA ribosomal RNA gene database project: improved data processing and web-based tools. Nucleic Acids Research 41(D1): D590–D596. https://doi.org/10.1093/nar/gks1219
  5. Rognes T, Flouri T, Nichols B, Quince C, Mahé F (2016). VSEARCH: a versatile open source tool for metagenomics. PeerJ 4: e2584. https://doi.org/10.7717/peerj.2584
  6. Wang Q, Garrity GM, Tiedje JM, Cole JR (2007). Naïve Bayesian classifier for rapid assignment of rRNA sequences into the new bacterial taxonomy. Applied and Environmental Microbiology 73(16): 5261–5267. https://doi.org/10.1128/AEM.00062-07

What your report includes

  • Taxonomic composition: top-10 bar plots, heatmaps, phylogenetic tree of the top 100 genera
  • Shared and unique taxa: Venn and flower diagrams, ternary plots
  • Alpha diversity: indices, rarefaction, rank-abundance and species-accumulation curves
  • Beta diversity: UniFrac heatmaps, PCA, PCoA, NMDS, PERMANOVA / ANOSIM / MRPP results
  • Biomarkers (LEfSe) and predicted functions (PICRUSt2, BugBase, FAPROTAX)
  • Raw and clean data (FASTQ), ASV tables and a methods text for your manuscript

Frequently asked questions

16S amplicon or shotgun — which should I choose?

16S amplicon sequencing is cheaper and shows which bacteria are present. Shotgun sequencing costs more but also shows genes and functions. We can advise based on your budget and question.

Can I send soil or water directly?

Yes. Send raw samples (soil, water, stool, tissue, food) or extracted DNA. Say in your request whether DNA extraction is needed.

Which region of 16S do you sequence?

The V3–V4 region, sequenced on Illumina NovaSeq 6000 (PE250).

Ready to start?

Have a sequencing project in mind?

Tell us your organism, sample type and what you want to find out. We will reply with the right service and a quote.

Or call +880 1308-222824